

By Rita Rosenthal. UC Berkeley teamed up with Google to launch a building density dashboard that assists space planners with developing and monitoring space usage during the pandemic. Prior to the dashboard, the task of tracking density and space usage was done manually. Not only was this a difficult and tedious process, but it also left lots of room for inaccuracies, and information quickly became static.
This new free campus service uses a web-based application to simplify the space planning process, and gives employees responsible for planning and managing campus spaces (e.g., buildings, floors, rooms) an accurate, anonymous, real-time people count—helping them make decisions about space.
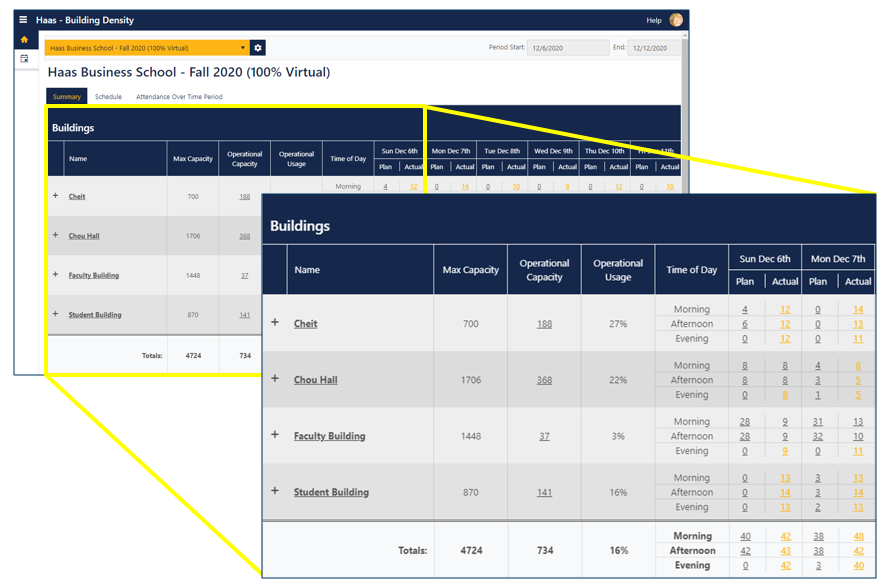
The building density dashboard
- Calculates the space availability and density under current COVID-19 guidelines,
- Automates the process of collecting space usage requests from students, faculty, and staff,
- Sends an alert when space usage requests exceed approved capacity,
- Streamlines the approval process by allowing electronic sharing of space planning between reviewers, and
- Ensures continued compliance with the plan through real-time monitoring of space usage.
How It Works
With the dashboard, the space usage plan is automatically generated in real time by aggregating data from sources such as spreadsheets, campus systems, department databases, group calendars, and more. It provides the user with both a high level and a detailed view of their space usage needs. Real-time monitoring of space usage is accomplished through the monitoring of anonymized Wi-Fi client activity. The details of a plan and actual data are then rolled up into a simple dashboard that can be shared for review with team members. Multiple plans can then be combined and rolled up for review by campus leadership.
A Campus Collaboration That Extends across UC
The original concept for the dashboard came about as part of the recovery efforts at the Haas School of Business. Courtney Chandler, senior assistant dean and chief strategy and operating officer at Haas, led these efforts. She said, “The initial vision was to develop a tool that would simplify our workflows and allow us to be operationally ready to quickly adapt to an ever-evolving situation.”
Tasked with overseeing the development of the dashboard, Haas Associate CIO Pierre Chew partnered with other Haas operations teams (facilities, HR, event management) and leveraged the school’s agile development team and the Google Cloud suite of products to deliver an early version in three weeks.
Associate Vice Chancellor for IT and CIO Jenn Stringer and Executive Director of Enterprise Applications Jody Couch championed the decision to overlay space usage data, in the form of Wi-Fi traffic, on top of the space planning data as part of the campuswide COVID-19 IT recovery efforts.
Once the dashboard was released to the rest of campus, the feedback from early adopters was very positive. “The building density dashboard is meeting a huge need in the ASUC Student Union. So much so, we would like to explore this as an option for our dining halls,” said Michelle White, strategic initiatives manager in Student Affairs IT.
As the solution continued to gain traction on campus, the decision was made to formally add this project to the list of One IT community COVID-19 recovery projects and to share the cost for developing and hosting the solution between central IT and the Haas School of Business.
“The density dashboard is such a great example of One IT in action!” Stringer said. “Since developing our community six years ago, we continue to strengthen our ability to be an incubator for some of the most innovative and cost-effective campuswide IT initiatives. This pandemic has required us to use our collective creativity, enabling us to offer solutions to campus challenges, as they arise.”
Stringer, Couch, and Chew recently presented the dashboard to the UC IT Leadership Council and they are open to helping other UC locations develop something similar. Chew recently worked with Camilla Tubbs, associate dean for UC Hastings Library and Technology, to launch the density dashboard there, “I am very impressed with the swift implementation of this software at UC Hastings. With so many challenges to safely reopening a campus, it was a tremendous relief to be able to quickly deploy this intuitive dashboard. While our implementation was easy, I know that this did not happen without substantial effort and creativity of Pierre and the Haas operations teams. I am grateful UC Hastings was able to partner on another successful UC IT project.”
The Building Density Dashboard is one of several tools developed to assist the campus community with navigating COVID-19 related challenges. To learn more about this project, visit Building Density Dashboard FAQ. If you are interested in using this solution or developing your own at your campus please contact helpdesk@haas.berkeley.edu.
 Rita Rosenthal is communications manager, Office of the CIO, UC Berkeley.