
By Ghanya C. Thomas. Medical doctor Kirsten Bibbins-Domingo recalls a conversation with a patient who had heart failure: “I’m always emphasizing to my patients the importance of eating fruits and vegetables and this one time during our visit the patient said, ‘Hey doc, you’d be so happy for me, I’m following all the advice you gave me. I go to Walgreens and I eat this can of vegetable soup every single day.’ I was like uh no, that’s not what I meant. And he was one hundred percent serious.”
Bibbins-Domingo said that exchange is an important reminder for doctors to really understand their patient’s environment. “Where you live, work, and play is where a lot of the things that influence health happens. It’s also where we start to see patterns of health.”
Bibbins-Domingo, Ph.D., MD, is co-founder of the UCSF Center for Vulnerable Populations and vice dean for the Population Health and Health Equity Center within the UCSF School of Medicine. She also serves as the chair of the UCSF Health Atlas project, which launched in April 2020.
When she stepped into her role as vice dean in 2017, she was mindful that UCSF as a health sciences campus primarily focuses on individual health; but population health, an interdisciplinary study, involves tracking group health patterns. She and her cohort of UCSF researchers, data specialists, and design technologists set out to determine the best way to visualize the underlying forces that shape population health and health inequities within California neighborhoods. They settled on creating a map, the Health Atlas.
But as the project neared completion, COVID-19 hit, revealing a crisis happening within a crisis. Low-income Black and Latinx communities already are burdened with racial health disparities, social inequities, and pre-existing health conditions. High rents force residents into cramped housing conditions where social distancing is nearly impossible. As “essential workers,” many can’t work remotely, and often rely on public transportation, thereby increasing the likelihood of contracting or transmitting a deadly and highly contagious virus.
“COVID-19 reminds us that you have to understand the social context of communities,” Bibbins-Domingo said. “That even though the pandemic affects all of us, it doesn’t affect us equally.” As the pandemic escalated, the Health Atlas lead, Debora Oh, PhD, Msc – acting on a suggestion from UCSF School of Medicine Dean Talmadge King – quickly instructed the development team to include COVID-19 data into the Health Atlas. As a result, the Health Atlas has six categorized data sets, called characteristics. These are COVID-19, demographic, socioeconomic, community, neighborhood, and health and healthcare. Each characteristic has disaggregated subcategories, along with an information summary that provides the data source, reference materials, and definitions of terms.
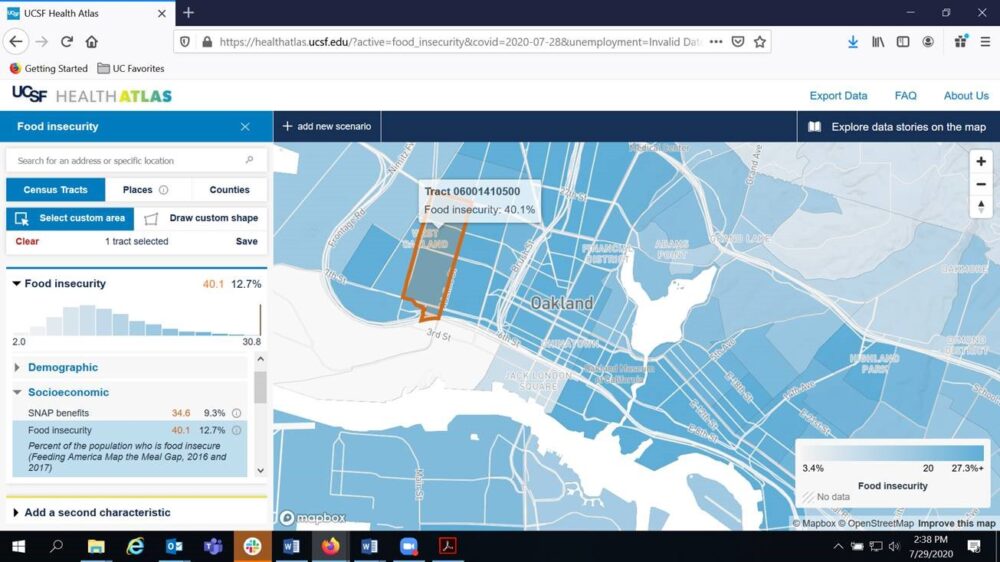
The map’s interactive interface allows users to quickly obtain up-to-date COVID-19 death and hospitalization information generated by the Los Angeles Times by county. Community advocates, policy makers, and researchers also can develop compelling data stories about California neighborhoods using US census tracts.
By bringing this data together, the Health Atlas provides a unique viewpoint around the interplay of social and health detriments, such as pre-school enrollment, health behaviors and outcomes, rent burden, computer access, SNAP benefits, food insecurity, incarceration rates, traffic density, etc. Users can customize single or multiple census tract searches and compare the characteristic statistics for each neighborhood.
The resulting snapshot can help health practitioners and community advocates understand how COVID-19 is impacting different neighborhoods as well as reimagine intervention strategies to improve health outcomes for vulnerable populations.
Bibbins-Domingo said that having access to so much data also can be a challenge. It is important for the health atlas to provide meaningful information. “How do we create a useful, yet functional interface that is true to the data and that researchers, policy analysts, and community advocates can explore? How do we tell the story?”
As the virus continues to trend, one notable aspect is how it falls along racial lines. According to the July 15 California Department of Public Health Report, the Latinx/Hispanic population is 39%, and 31% of COVID-19 deaths. For African Americans the mortality rate is nearly 9%, despite the fact African Americans are 6% of California’s population. Comparatively, for whites (36% of California’s population), COVID-19 deaths are 31%. Nationally, African Americans are three times as likely to die from COVID-19 as whites.
Many doctors and health analysts caution these outcomes are more about socio-economic factors, access to testing and treatment, implicit bias, and even the restrictions essential workers face in their ability to take time off to see a doctor – compounded by the added worry of whether or not the doctor’s office is even safe.
For Dr. Bibbins-Domingo these glaring disparities mean healthcare providers must close the gaps to ensure accessible and equitable healthcare. Muhammed Ali once said, “Wars of nations are fought to change maps, but wars of poverty are fought to map change.” She said, “In many ways we really are in a fight to map change. A fight to radically change our healthcare delivery, which includes where we place pharmacies and make investments in public transit systems. We believe the Health Atlas can help us see these communities through a more holistic lens, and hopefully we can use this moment to leverage the pandemic’s destruction to create real change.”
Shown above is a map from the UCSF Health Atlas depicting 40.1% food insecurity in a West Oakland, CA neighborhood. California’s average food insecurity is 12.7%. To learn more about the disparities in the impacts of COVID-19, watch a video presentation by Dr. Bibbins-Domingo.
 Ghanya C. Thomas is IT diversity outreach coordinator and executive assistant, Information Technology Services, UC Office of the President.