
By Eric Odell, Senior Systems Administrator, UCOP. The first commandment of systems administration is “If it moves, log it.” The second is “Look at the logs!” However, understanding the many millions of log messages generated by hundreds of systems managed by UCOP Information Technology Services (ITS) is a big data challenge.
There are many types of log sources, but they usually consist of time stamped records of who did what and where. Here’s an example:
Aug 17 05:40:01 ip-10-100-1-35 auditd[2270]: Audit daemon rotating log files
It’s not very interesting, and difficult to make sense of, if you have millions of different log messages a day. The old-fashioned reactive way of searching and distilling files with millions of log entries could take hours or days. For this reason, often the only time you looked at logs was when you were compelled to.
By contrast, log analysis lowers the time and energy required to understand what’s happening across many diverse systems and applications. This strategy enables ITS to be proactive instead of reactive.
For log analysis, ITS uses the open source ELK stack (Elasticsearch/Logstash/Kibana) to visualize what’s happening on hundreds of systems in real time by:
- Filtering and tagging logs (Logstash)
- Indexing filtered and tagged logs so they’re searchable (Elasticsearch)
- Querying indexed logs and visualizing the results (Kibana)
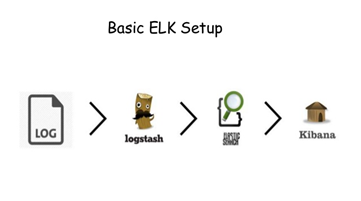
Users access Kibana through a browser, Kibana queries Elasticsearch, and Logstash ingests log sources and feeds Elasticsearch. So KEL or LEK is the correct acronym sequence but harder to market, so ELK it is.
Log analysis with the ELK stack
- Provides UCOP ITS with real-time alerts on log conditions,
- Separates the wheat from the chaff, enabling the discovery of a needle in hundreds of haystacks,
- Correlates the behavior of applications across systems and time, and
- Audits systems/applications/services.
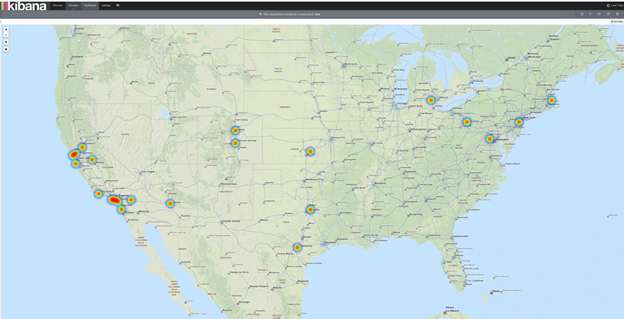
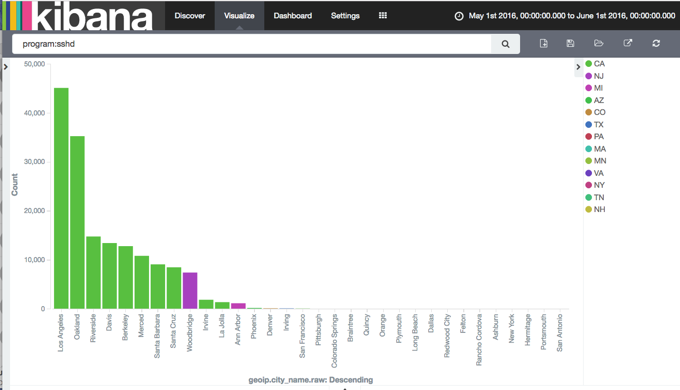
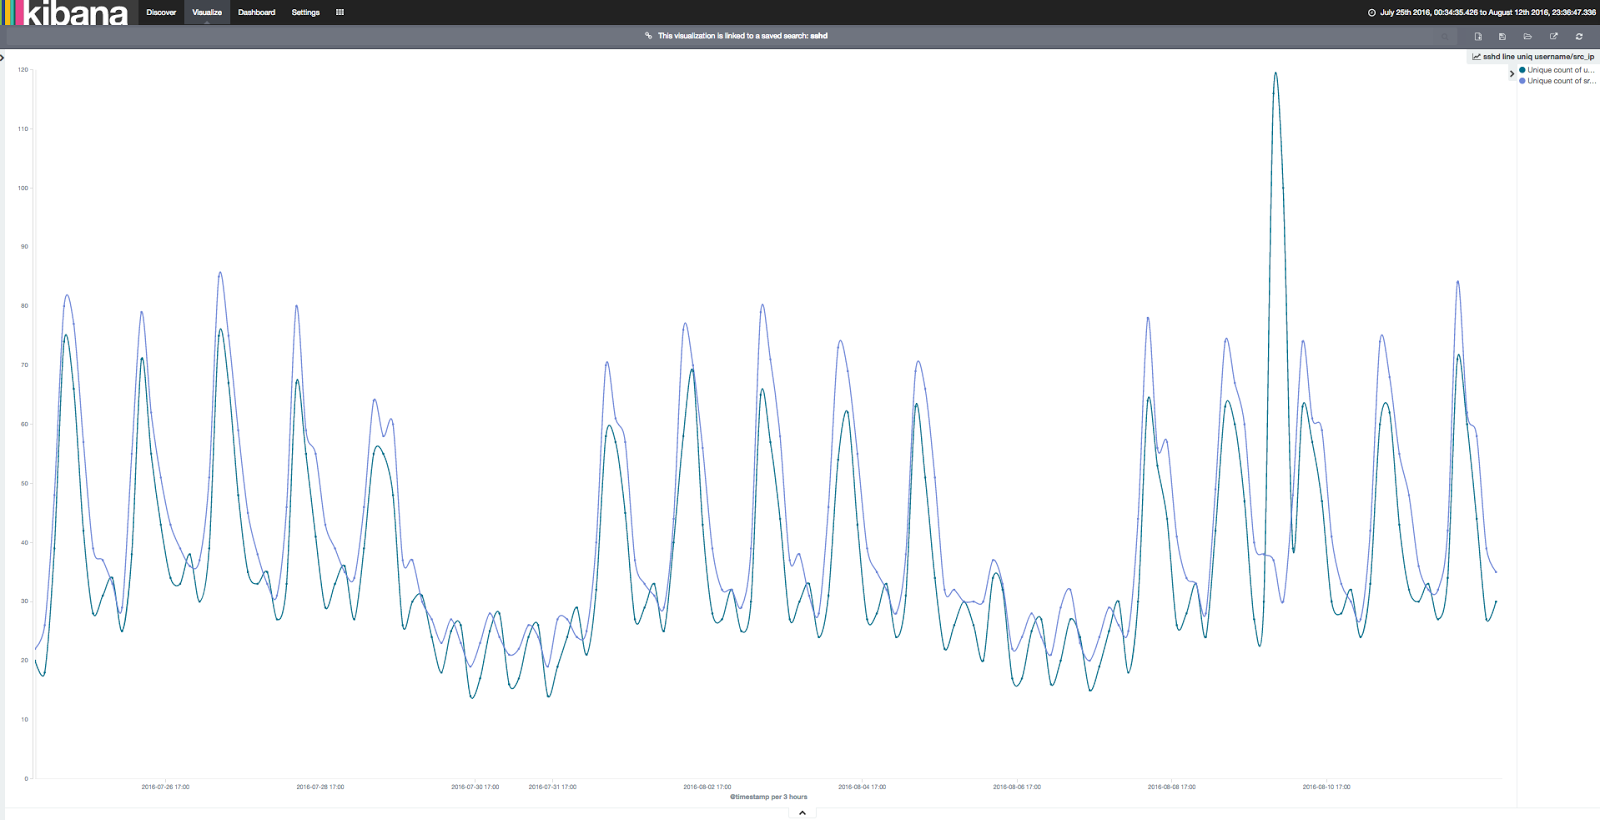
As an example, Kibana is used to visualize about one million log events of one service running on hundreds of systems. The heat map and bar chart below illustrates this UCOP service is mostly related to the UC campuses and working exclusively in the continental United States.
The histogram below shows the same service is busiest during business hours, Monday through Friday, but also demonstrates that UCOP never sleeps! If you’ve made it this far and still have questions about log analysis, please email me.
 Cover photo by: logz.io