
By Annelie Rugg. Behind every project are technical solutions and decisions about architecture we never hear about. In January the UC IT Blog showcased the Sautter award-winning Putting Youth on the Map (PYOM) project. Recently, I had a chance to interview the minds behind PYOM – Nancy Erbstein, the project PI and assistant researcher in Human Ecology at UC Davis, and Sara Watterson, GIS manager for the UC Davis Center for Regional Change GIS Manager. The focus of my interview was to answer the question, “how did they make that?”
What is Putting Youth on the Map?
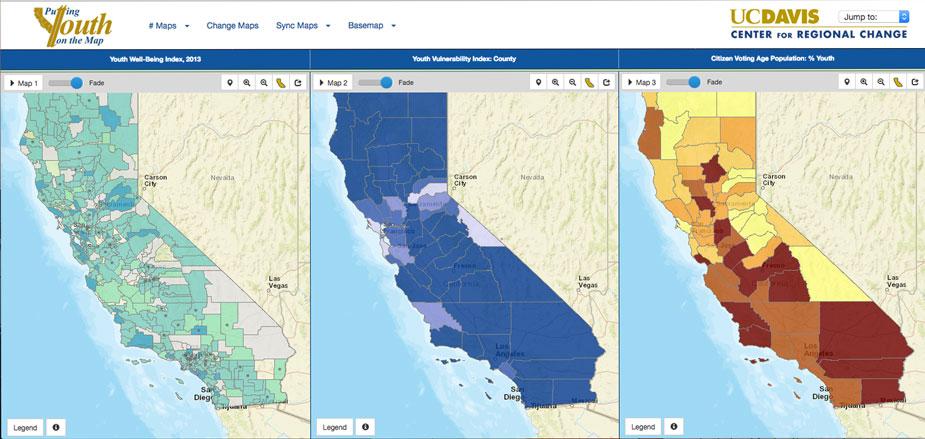
PYOM is a two-part website that provides youth equity advocates and adults concerned about youth well-being with access to secondary data and curated analyses of that data, without requiring technical skills. The core technical part is an interactive mapping site. The second part provides metadata, curricula, and a growing set of use cases for doing or learning about using data maps as an element of youth advocacy.
The whole package is important, Erbstein said, because “even a great website isn’t enough to ensure genuine access, especially for the audiences we’re trying to reach.”
Here is what’s going on behind the scenes:
- Back end: ArcGIS Server running ESRI APIs.
- Hosting: Locally hosted in a virtualized data center run by the UC Davis Computer Resourcing Unit (CRU), who also provide systems administration.
- Initial development: Contracted with Vestra, an outside vendor based in Redding, CA, for their ArcGIS development expertise.
- Other key roles: Sara Watterson handles ongoing maintenance of code and data updates. Multiple community partners as well as UC Davis grad and undergrad student interns in the CRC contributed to the design. Additional coding by UC Davis Center for Regional Change (CRC) programmers. Data team developed indices, collected secondary data, and ran and generated a curated set of analyses for community re-use. A community engagement team continues to help partners and youth to learn about and improve the resources on the site. Multiple funders contributed support.
- How long did it take to build? About a year for the initial beta version, including a lot of back and forth between the community and developers. It could have been built more quickly, but the innovative multi-layering of map data would never have happened without that community-developer interaction.
More insight from Erbstein and Watterson in the Q&A below:
Why the chosen architecture and design?
A beta version of PYOM was launched in 2012. At the time, ArcGIS Server was one of the few solutions that could handle the complicated analysis that happens behind each user click – displaying an index on a map, providing pop-up boxes with analyses via map location clicks, enabling users to click to other maps representing different data indices, and allowing users to view three maps at once. ArcGIS Server was customizable and allowed the flexibility to host other resources on the same platform as the maps. Design-wise, it was the needs of our community partners that was instrumental in realizing the core functionality of PYOM — the simultaneous viewing of multiple maps – which was so innovative at that time.
What works and what could be better?
PYOM does what we intended, which is to provide easy access to complex geo-referenced analyses, and to share and print those, with no tech skills needed. It is also mobile-friendly, thanks to additional updates by Vestra. Mobile access is especially important for community partners without reliable access to WiFi or computers. You can also export data from PYOM as KMZ files, so youth and advocates can bring our data into their own analyses and tools.
Given more time and resources, we would like to realize a key early objective, which is to facilitate links between PYOM and participatory mapping sites. We’ve done some work but haven’t been able to fully pursue this. And to enable users to export our analyses (visualizations), not just the raw data. PYOM would also benefit from being able to import and compare/overlay other data sets to our own. And after more than six years, the site would benefit from updates to its visual design and display.
For more information
To learn more about how the PYOM website was made, email Nancy Erbstein or the UC Davis Center for Regional Change.
 Annelie Rugg is Humanities CIO at the Center for Digital Humanities, UCLA.